Automate inserting charts in Google Sheets using Macros
In this tutorial, you'll learn how to use macros to automate inserting charts in Google Sheets. A macro is a feature in Google Sheets that allows you to record a certain set of actions and then reuse them to automate taking the same set of actions in the future.
Please see the tutorial on Macros in Google Sheets for more information on macros. In this tutorial, I will explain how to use macros to insert charts in Google Sheets.
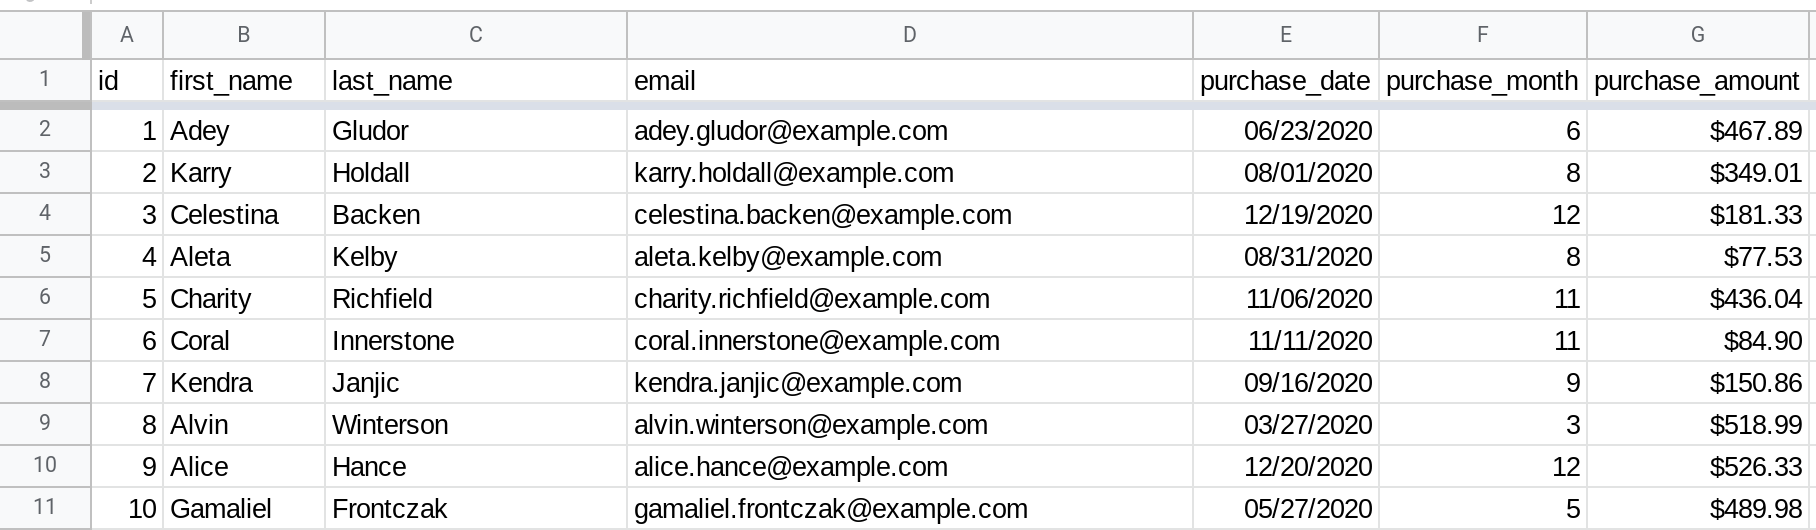
Let's imagine that you run an eCommerce store and you've exported all the purchases your customers have made over the past year into a Google Sheets spreadsheet. The spreadsheet contains the following columns: purchase_id, first_name, last_name, email, purchase_date, purchase_month and purchase_amount.
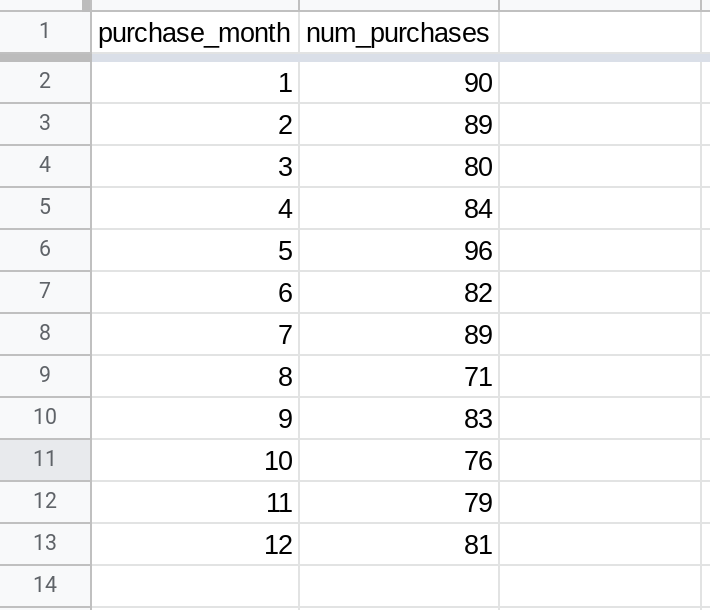
You then create a table that summarizes the number of orders per month and want to visualize this information using a bar chart.
You can obviously create a bar chart manually but you want to automate this process because you plan to run this analysis every month for the preceding 12 months of orders.
Use macros to automate the process of visualizing your data
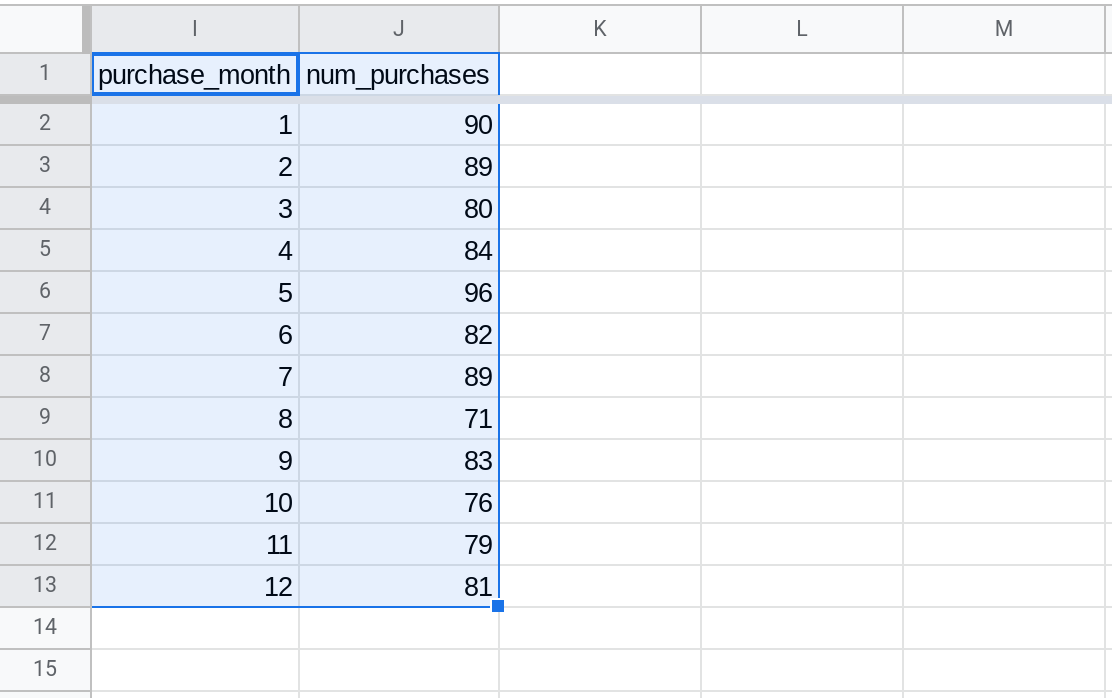
First select the data that you want to visualize.
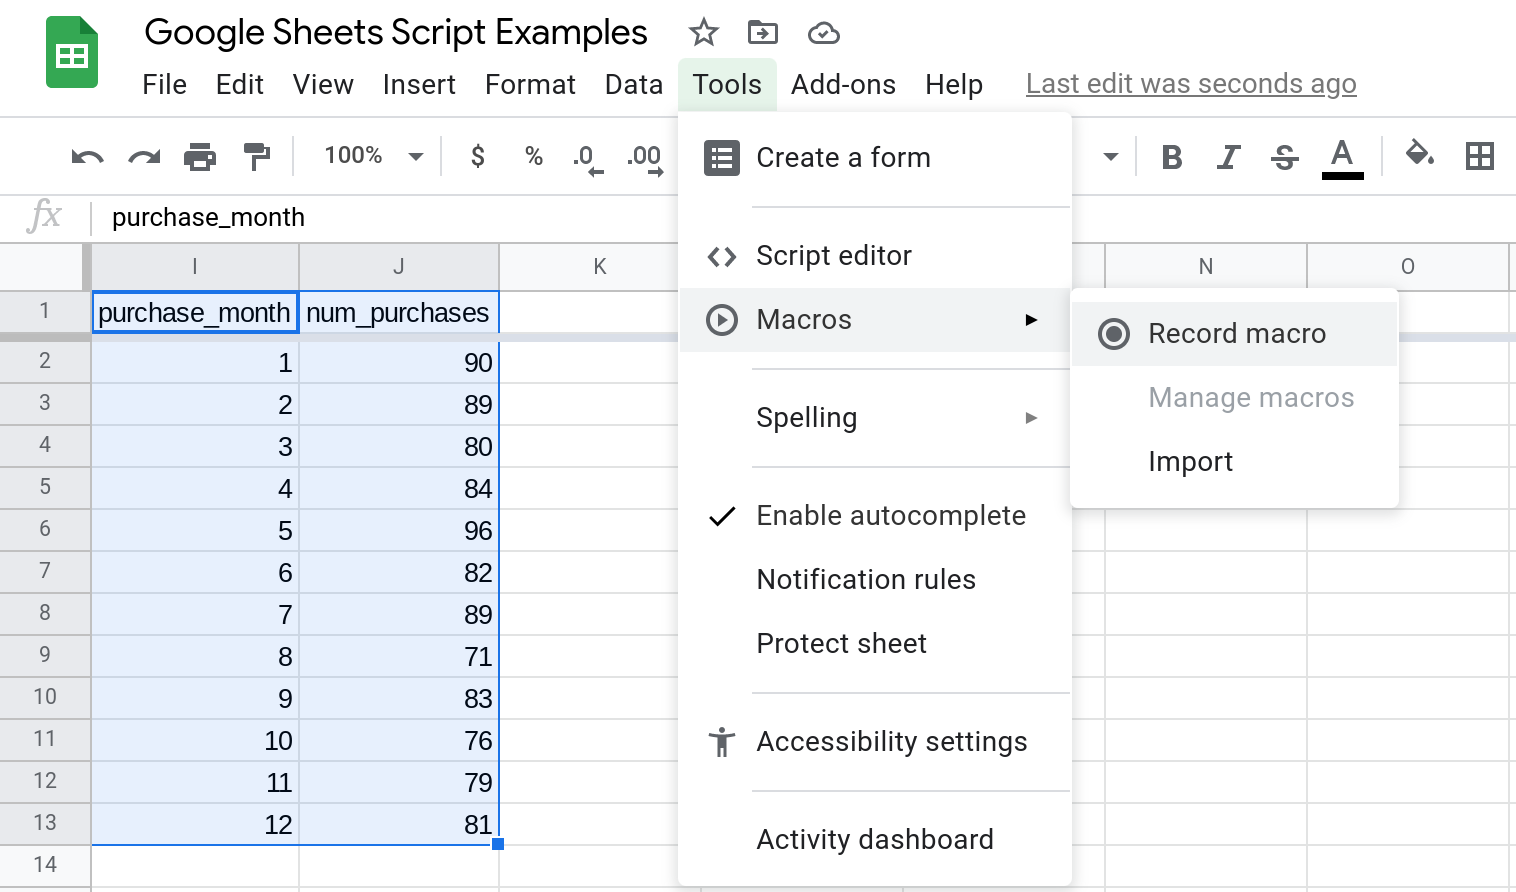
Then begin recording a macro by selecting Tools → Macros → Record macros.
Choose "Use relative references" since you want to visualize the selected range.
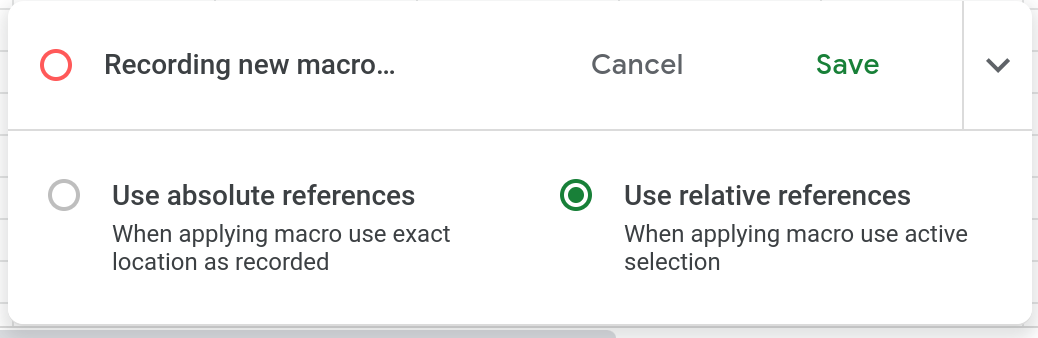
Then insert the chart and customize it based on your preferences. When you are done, click Save to save your macro and give it a name.
Now, when you want to insert the same chart with updated data, just select the data and run this macro from the Tools → Macros menu.
The macro will create the chart and even set the title for you. All you need to do is to run the macro!
Behind the scenes, Macros are just Apps Script code
To view the script corresponding to a macro, just select Tools → Macros → Manage macros. Then click the three dots menu and select Edit script. This will open the Apps Script editor where you can view the code that corresponds to your macro.
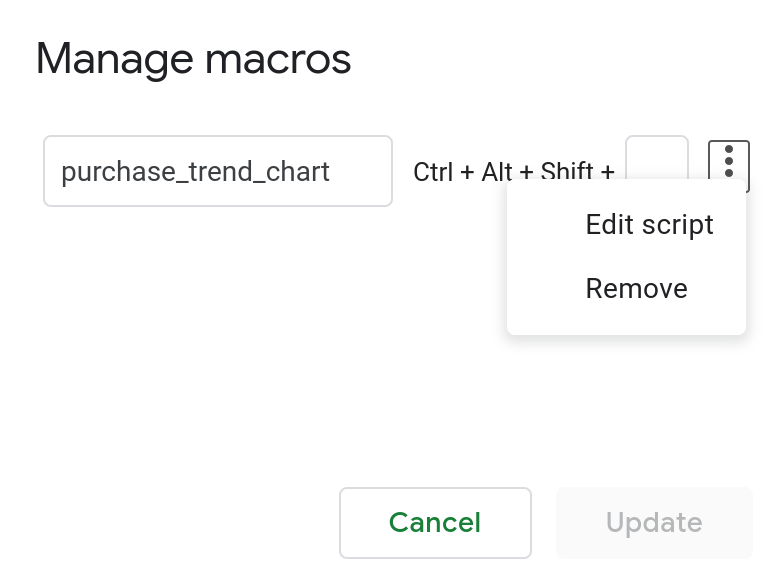
You will see a file called macros.gs in the Apps Script editor. The code for all the macros in the Google Sheets spreadsheet will be present in this file. Each macro will be a function that has the same name as that of the macro. Since I named the maco "purchase_trend_chart", there is a function in the macros.gs file that has the same name.
I have copy pasted the auto-generated code below. You'll notice that there is a lot of unnecessary and repetitive code in the macro. For example, the code first creates a line chart. Then it deletes the line chart and creates a column chart instead. Then it deletes the column chart and creates another column chart with different settings. This third chart is then the final output.
The reason for this is that the macro is literally copying your actions step-by-step. When we write code, we try to directly create the output we want. Here, since the code is being generated automatically, the system doesn't know what the final output should look like. Therefore, it records every single step. Since a line chart is the default chart that gets created when you select Insert → Chart, some code is generated to create this line chart first. Then when you change the chart's type to column chart, more code is generated to delete the line chart and create a column chart instead. Therefore, although the auto-generated code will produce the correct output, it can be inefficient since it is going to literally go step-by-step.
function purchase_trend_chart() {
 var spreadsheet = SpreadsheetApp.getActive();
 var sheet = spreadsheet.getActiveSheet();
 var chart = sheet.newChart()
 .asLineChart()
 .addRange(spreadsheet.getActiveRange())
 .setMergeStrategy(Charts.ChartMergeStrategy.MERGE_COLUMNS)
 .setTransposeRowsAndColumns(false)
 .setNumHeaders(1)
 .setHiddenDimensionStrategy(Charts.ChartHiddenDimensionStrategy.IGNORE_BOTH)
 .setOption('useFirstColumnAsDomain', true)
 .setOption('isStacked', 'false')
 .setOption('title', 'num_purchases vs. purchase_month')
 .setXAxisTitle('purchase_month')
 .setYAxisTitle('num_purchases')
 .setPosition(2, 9, 88, 16)
 .build();
 sheet.insertChart(chart);
 var charts = sheet.getCharts();
 chart = charts[charts.length - 1];
 sheet.removeChart(chart);
 chart = sheet.newChart()
 .asColumnChart()
 .addRange(spreadsheet.getActiveRange())
 .setMergeStrategy(Charts.ChartMergeStrategy.MERGE_COLUMNS)
 .setTransposeRowsAndColumns(false)
 .setNumHeaders(1)
 .setHiddenDimensionStrategy(Charts.ChartHiddenDimensionStrategy.IGNORE_BOTH)
 .setOption('useFirstColumnAsDomain', true)
 .setOption('isStacked', 'false')
 .setOption('title', 'num_purchases vs. purchase_month')
 .setXAxisTitle('purchase_month')
 .setYAxisTitle('num_purchases')
 .setPosition(2, 9, 88, 16)
 .build();
 sheet.insertChart(chart);
 charts = sheet.getCharts();
 chart = charts[charts.length - 1];
 sheet.removeChart(chart);
 chart = sheet.newChart()
 .asColumnChart()
 .addRange(spreadsheet.getActiveRange())
 .setMergeStrategy(Charts.ChartMergeStrategy.MERGE_COLUMNS)
 .setTransposeRowsAndColumns(false)
 .setNumHeaders(1)
 .setHiddenDimensionStrategy(Charts.ChartHiddenDimensionStrategy.IGNORE_BOTH)
 .setOption('bubble.stroke', '#000000')
 .setOption('useFirstColumnAsDomain', true)
 .setOption('isStacked', 'false')
 .setOption('title', 'Purchase trend (last 12 months)')
 .setOption('annotations.domain.textStyle.color', '#808080')
 .setOption('textStyle.color', '#000000')
 .setOption('legend.textStyle.color', '#1a1a1a')
 .setOption('titleTextStyle.color', '#757575')
 .setOption('annotations.total.textStyle.color', '#808080')
 .setXAxisTitle('purchase_month')
 .setOption('hAxis.textStyle.color', '#000000')
 .setYAxisTitle('num_purchases')
 .setOption('vAxes.0.textStyle.color', '#000000')
 .setPosition(2, 9, 88, 16)
 .build();
 sheet.insertChart(chart);
};
You can simplify the above code by getting rid of the unnecessary steps. When you save the script, your macro will use this updated version of the script.
function purchase_trend_chart() {
 var spreadsheet = SpreadsheetApp.getActive();
 var sheet = spreadsheet.getActiveSheet();
 var chart = sheet.newChart()
 .asColumnChart()
 .addRange(spreadsheet.getActiveRange())
 .setMergeStrategy(Charts.ChartMergeStrategy.MERGE_COLUMNS)
 .setTransposeRowsAndColumns(false)
 .setNumHeaders(1)
 .setHiddenDimensionStrategy(Charts.ChartHiddenDimensionStrategy.IGNORE_BOTH)
 .setOption('bubble.stroke', '#000000')
 .setOption('useFirstColumnAsDomain', true)
 .setOption('isStacked', 'false')
 .setOption('title', 'Purchase trend (last 12 months)')
 .setOption('annotations.domain.textStyle.color', '#808080')
 .setOption('textStyle.color', '#000000')
 .setOption('legend.textStyle.color', '#1a1a1a')
 .setOption('titleTextStyle.color', '#757575')
 .setOption('annotations.total.textStyle.color', '#808080')
 .setXAxisTitle('purchase_month')
 .setOption('hAxis.textStyle.color', '#000000')
 .setYAxisTitle('num_purchases')
 .setOption('vAxes.0.textStyle.color', '#000000')
 .setPosition(2, 9, 88, 16)
 .build();
 sheet.insertChart(chart);
};
As I mentioned in the other tutorial on macros, I often record macros to learn how to do something in Apps Script. I will record a macro and then I'll review the auto-generated code to learn how to use Apps Script to take the same action. This can be a simple way to improve your coding skills over time.
Conclusion
In this tutorial you learned how to automate inserting charts in Google Sheets using macros.
Thanks for reading!
DISCLAIMER: This content is provided for educational purposes only. All code, templates, and information should be thoroughly reviewed and tested before use. Use at your own risk. Full Terms of Service apply.
Thanks for your feedback!
Your input helps improve the content for everyone.
