Solve the Monty Hall problem using simulation and Google Sheets
The Monty Hall problem is a probability puzzle that became famous in 1990 because its solution is counterintuitive.
The Monty Hall problem
Suppose you're on a game show, and you're given the choice of three doors: Behind one door is a car; behind the others, goats. You pick a door, say No. 1, and the host, who knows what's behind the doors, opens another door, say No. 3, which has a goat. He then says to you, "Do you want to pick door No. 2?" Is it to your advantage to switch your choice?
If you were faced with this situation, what would you do? Will you stick to your choice or will you switch your choice?
In order to answer this question, you will need to find out which course of action will maximize your chances of winning the car. This, of course, assumes that you prefer winning a car to a goat but we'll leave that aside for now :).
There are multiple ways to solve this puzzle. For example, you could approach it like any other probability question and solve it mathematically. In this tutorial, I will show you how you can solve this puzzle using Google Sheets.
How to solve the Monty Hall problem using Google Sheets?
Many probability puzzles can be solved using simulations. Instead of solving the puzzle mathematically, you create a computer model that you can run repeatedly to understand the outcomes produced by various strategies.
In this case, to solve the Monty Hall problem using simulation, we will first need to build a model that will let us simulate what will happen for the following two strategies: (1) stick with our choice and (2) switch our choice.
Then, we will repeat this process a large number of times to find out how many times we win the car by following each strategy. The probability of winning using a strategy is simply the number of simulations where that strategy resulted in you winning the car divided by the number of simulations run. If you want to maximize your chance of winning the car, you should pick the strategy whose probability of winning is higher.
I will show you how to create a model in Google Sheets for the Monty Hall problem and then run multiple simulations to determine which strategy is better. Should you stick with your initial choice or should you switch?
Prerequisites
This tutorial assumes that you know the basics of Google Sheets (including how to use formulas). You don't need to know probability theory or any other complex concept!
4 steps to simulate the Monty Hall problem in Google SheetsStep 1 — Build a model in Google Sheets to represent the Monty Hall problem
First we need to create a model in Google Sheets to represent the Monty Hall problem. Each row will represent a single simulation. A simulation is a single instance of the problem where you make a choice using each strategy and see if you win.
We'll use the following 5 columns to represent a single simulation:
Column | Header | Formula | Description |
|---|---|---|---|
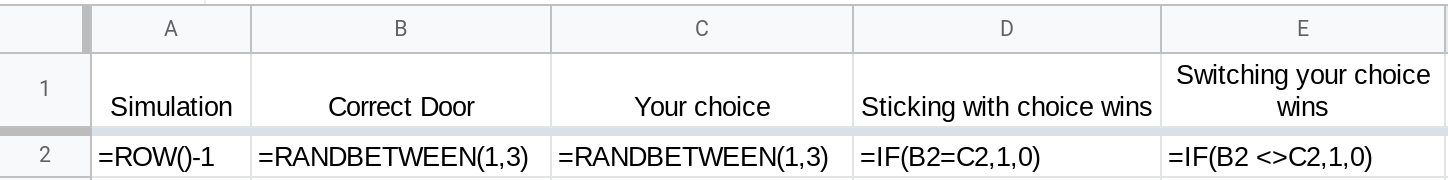
A | Simulation | =ROW() - 1 | A counter to track the number of simulations run. |
B | Correct door | =RANDBETWEEN(1,3) | A random number between 1 and 3 representing the door that the car is behind. |
C | Your choice | =RANDBETWEEN(1,3) | A random number between 1 and 3 representing the door you initially pick. |
D | Sticking with choice wins | =IF(B2=C2,1,0) | If your initial choice was the correct door, sticking with your choice will win and the formula evaluates to 1. Otherwise you'll lose and the formula evaluates to 0. |
E | Switching choice wins | =IF(B2 <>C2,1,0) | If your initial choice was the wrong door, switching your choice will win and the formula evaluates to 1. Otherwise you'll lose and the formula evaluates to 0. |
The above model works in the following way:
Column A tracks is an ordinal counter that helps us track the number of simulations that have been run. Since the spreadsheet has a header row, the 2nd row is the first simulation. This is why the formula in column A is
=ROW() - 1.In each simulation, there is exactly one door that the car is behind. Since there are three doors, we will randomly pick the door the car is behind by using the
=RANDBETWEEN(1,3)formula. Column B contains this information.The next step is for you to make your initial choice, which we'll record in column C. Since you do not have any information at this time, let's assume that you pick the initial door randomly. So again, we'll use the
=RANDBETWEEN(1,3)formula to determine the door you'll pick. Remember that you do not know which door the car is behind (you sort of do in the model because you'll see it in column B but the point is your choice is independently made since you won't know the correct door in real life).Now that you know the correct door and your initial choice, we need to test each strategy and see if it will result in you winning the car.
Suppose columns B and C both have the same door number. This means that you picked the door correctly and sticking with your choice will result in you winning the car.
On the other hand, if columns B and C were not the same, it means that you picked the wrong door and switching your choice is what will win you the car.
Note:
Remember that once you pick a door, the host opens a door other than the one you picked that has a goat behind it. This means that ultimately the goat is either behind the door you originally picked or the remaining one that you can switch to.
When the values in columns B and C are not the same it means that the door you picked (column C) is not the door the car is behind (column B) and switching your choice is the correct move.
In each simulation (i.e., row), we will record a
1against each strategy if that strategy wins and a0if that strategy loses. We will use column D for the strategy where you stick with your initial choice and column E for the strategy where you switch your initial choice.In column D, we will use the formula
=IF(B2=C2,1,0)to record a 1 if the values in columns B and C are the same and a 0 otherwise.In column D, we will use the formula
=IF(B2<>C2,1,0)to record a1if the values in columns B and C are NOT the same and a0otherwise.
When you're done creating the above model, you should see a sheet like the one below.
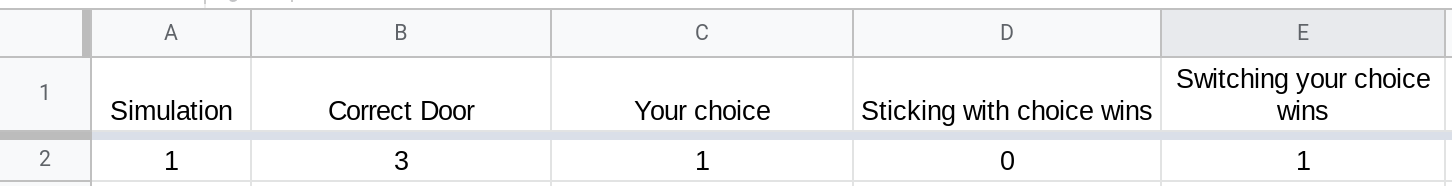
The formulas corresponding to the above cells are as follows:
Row 2 represents a single simulation of the Monty Hall problem and columns D and E show you whether a specific strategy wins for this specific simulation. In the above illustration, switching your choice is the strategy that wins.
Step 2 — Run 1000 simulations in Google Sheets
The next step after you create the model is to run the simulation a large number of times. The more simulations you run the better you'll be able to correctly estimate the probability of winning for each strategy. However, you don't have to run infinitely many simulations since you'll be able to estimate the probabilities after even a few hundred simulations.
Since each row represents a simulation, all you need to do to run say 1000 simulations is fill the formulas to 1000 rows by using the fill handle.
Step 3 — Tabulate results
Once you have results from the 1000 simulations, the next step is to see how good each of the two strategies are. To do this, simply sum up the values in each of the two columns D and E. The sum of values in column D will tell you the number of simulations in which sticking with your choice ended up winning you the car. The sum of values in column E will tell you the number of simulations where switching your choice would have won you the car.
In my spreadsheet, these values were as follows:
Sticking with your choice:
Sum of values in column D (
=SUM(D:D)): 336Switching your choice:
Sum of values in column E (
=SUM(E:E)): 664
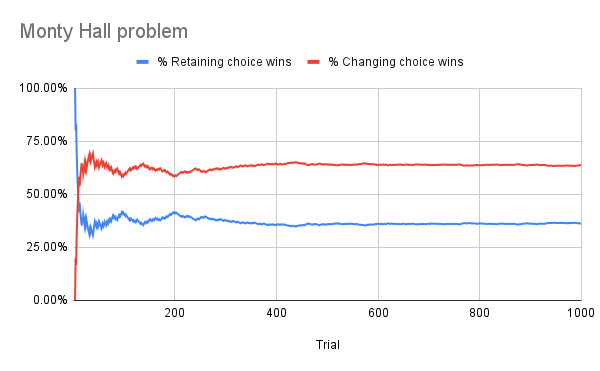
Therefore, based on the 1000 simulations that I ran, switching your choice would have resulted in you winning the car 66.4% of the time and sticking with your initial choice would have resulted in you winning the car only 33.6% of the time.
I also plotted these percentages as a function of the number of simulations and as you can see they converge over time. One thing that immediately stands out from the graph is that switching your choice is clearly the better strategy and will result in you winning the car roughly two thirds of the time.
Step 4 — Determine the winning strategy for the Monty Hall problem
According to the results from the simulation, sticking with your initial choice will result in winning the car only one thirds of the time whereas switching your choice will win you the car two thirds of the time.
Therefore, to maximize your odds of winning the car, you should switch your choice.
Conclusion
In this tutorial, I showed you how to use Google Sheets to run simulations and solve the famous Monty Hall problem without using any probability theory!
Whenever you're faced with a business problem involving chance, consider using simulations to determine the optimal strategy to pursue. Using Google Sheets, you can build a model to represent the problem at hand and then quickly run several simulations to figure out which strategy to pursue. The best part is you don't have to know detailed probability theory to determine the right course of action.
Thanks for reading!
DISCLAIMER: This content is provided for educational purposes only. All code, templates, and information should be thoroughly reviewed and tested before use. Use at your own risk. Full Terms of Service apply.
Thanks for your feedback!
Your input helps improve the content for everyone.
